
Every month, we publish the Milton Price Report for our SoldWatch subscribers.
In the report, we research the statistics for days on market, new listings compared to number of sales, and we even break down the specific numbers for each property type in Milton. I believe it’s the most complete analysis of properties in Milton, and we’re also one of the few companies who talk about sale prices.
In 2018, it’s been a year where different properties are doing completely different things.
Condos have been performing completely differently than semi-detached homes. Detached single-family homes are a totally different animal than townhouses.
At the end of September 2018, I wanted to look at the year-over-year changes that have happened in the market. For this analysis, we looked at the ENTIRE Greater Toronto Area, not just Milton. Because our main goal is to see what happened with buyer behaviour across the board.
Remember that buyers have choices. They can choose to buy a smaller home in a more central location, or they can buy larger homes further away. But ultimately, the price point they choose is where the “rubber meets the road” and we see the value of the asset they felt comfortable purchasing.
But first, some history…
On January 1, 2018, the government introduced an extra stress test for all buyers in the market. Practically speaking, buyers must now qualify for payments at a higher interest rate than their ACTUAL mortgage rate. It has the effect of reducing maximum purchasing power by about 16-17% in most cases.
There have also been a few interest rate increases by 0.25% (also known as 25 basis points) each time. Combined, these rate increases have reduced purchasing power by another 9%, give or take.
It’s fair to say that buyers in 2018 can buy about 25% less property than they could have been able to buy at the beginning of 2017.
September 2017 to September 2018… one year later
Why choose September for a point of analysis? Well, after the crazy market of Spring 2017, most of the “normal” behaviour returned to the market by the time the leaves began changing colour. The people who didn’t need to sell took their homes off the market through the summer, and with back-to-school upon many families, it’s typically a return to regular schedules and a regular market.
Here’s what we found when we looked at the number of sales at each price point:
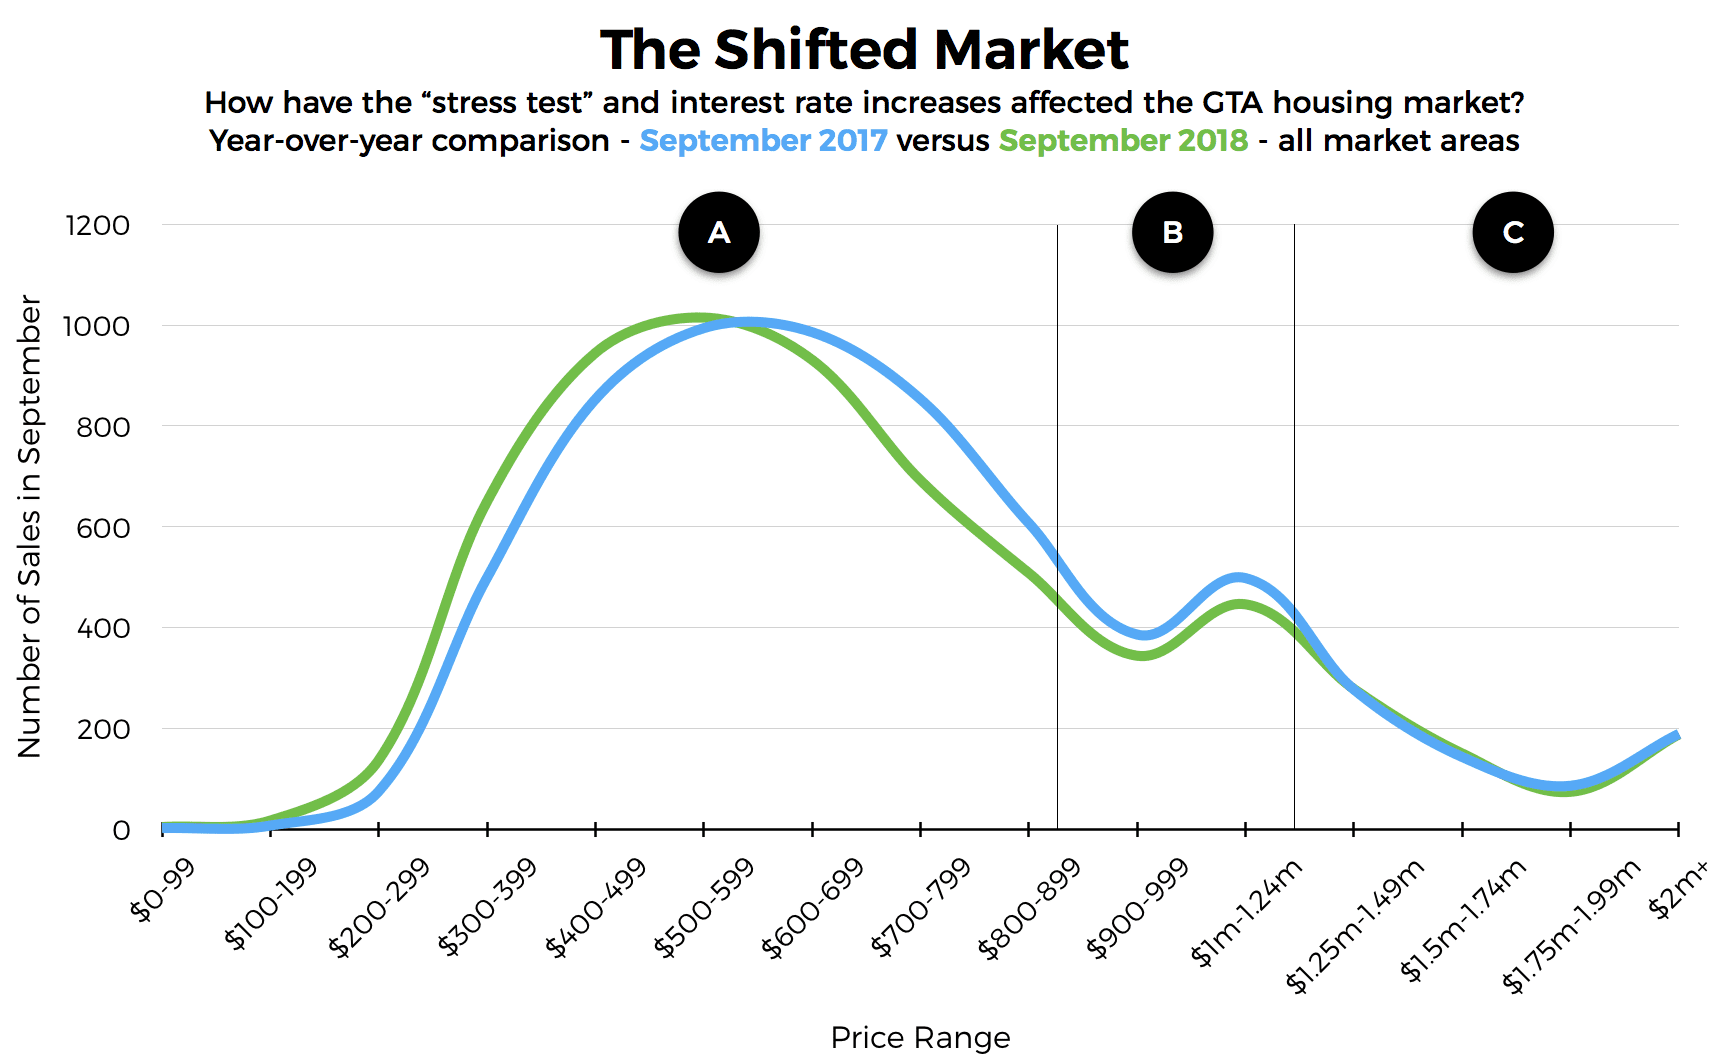
At first glance, you probably notice the similar shapes of the two lines. There’s a pretty regular flow to the demand in different price ranges, and it shows the “meaty” areas of demand, somewhere in the $500,000-$600,000 range.
But when I looked at this one closer, I discovered three different stories at three different price points.
Remember this is based on statistics from the Greater Toronto Area, but what makes it relevant to Milton is our AVERAGE price in this community is very similar to the entire GTA average house price. Our community is a very good representation of the GTA market as a whole.
Section A:
These buyers are in the entry-point of the market, and we can see that there was a noticeable shift in behaviour. Their purchases have absolutely shifted (on the graph from right to left) to buy less home than they did last year. But the interesting thing to note is that they didn’t shift 25%, which you would expect because of the stress test and the rate increases mentioned earlier. It was more like 5-10%.
Why didn’t it drop more? Our most obvious answers would be the rise in minimum wage, the fact that the economy has improved and buyers could be earning more. Or it might even be that many parents of these buyers in the “Baby Boomer” generation, have been downloading assets to the younger generation. We read a report recently that estimated 1/3 of all home purchases are assisted by parents or older relatives.
Section B:
These are often the move-up buyers with existing assets, including their home. The shift in this category was not right-to-left, but rather up-moving down. That means there were just less transactions in this range, roughly $820,000 to $1.1 million. The buyers in this section, unless they NEEDED to move, have just sat on the sidelines and watched how things have unfolded.
Section C:
The luxury market above $1.1 million, all the way up to $2 million plus, has had ZERO change year over year. Our best guess is that these buyers represent the segment of the market that aren’t really affected by market adjustments, as their income and assets can make up for any small-to-medium changes in the market.
That’s one of the most interesting things to watch when markets go down… the very top price range doesn’t seem to care about the market. They are feature-focused buyers, and when they find something they want, they’ll buy it regardless of what’s happening with interest rates or mortgage rules.
What does it mean moving forward?
To me, this means that the demand for housing has remained strong, despite the drop of 25% in purchasing power.
Anybody predicting a bubble knows nothing about what actually causes bubbles, of which there are two major causes that work together to blow up the market:
1. Double-digit price increases in three consecutive years
2. Large volume of purchases as speculation
Leading up to 2017, our market increased by roughly 9% two years in a row in 2015 and 2016. Obviously something had to break in Spring 2017 as the prices rose by roughly 5% per month, and it did. Then things returned back to normal, and we’re back to a projected 5% per year increase in 2018. That’s still a little high, but relatively sustainable in the short-term.
People want to buy homes, and restrictions in supply of housing have fueled price increases for more than a decade. The demand is too strong, and supply is too restricted, to cause the bottom to fall out of this market.
Small adjustments in interest rates can have big effects on affordability, but buyers are still finding ways to work around these increases, possibly with help from B.O.M.D., also known as “Bank of Mom and Dad”.
This graph also shows that different segments of the market must be analyzed differently, instead of the one-size-fits-all approach seen in most mainstream media.
Most importantly, it means you should stay tuned for the most in-depth analysis of the market you’ll find anywhere.